Why Carol Webb took a while to even realise she was a carer
Posted on 14 Oct 2026
Carers Victoria is holding an event this afternoon (October 14) during National Carers Week to…
Posted on 27 May 2026
By Nick Place, journalist, Community Directors

Maria Owen is the CEO of ImpactLab, a New Zealand social enterprise that analyses data for charities and other social impact organisations and their funders, a function that is also gaining traction in the Australian NFP sector. We asked Maria how ImpactLab works.
Yes! I’ve got Samoan, Italian, Irish on my side, and my husband’s half Swedish, so we’ve got a bit of everything.
I’ve been trying. I tried to learn Italian as a kid, and I tried to learn Samoan a couple of years ago, but then I met this Swedish fellow and I found that trying to hold Samoan and Swedish in my head at the same time was a no-go, so I had to put one aside and now I’m focused on the Swedish.
Yep, we help primarily charities and their funders to link up frontline charity data with government data, and with academic evidence, to produce long-term impact modelling – as in, if you invest in the service, what does that mean in the long term for the people receiving it? And what does that mean for the community as a whole? We help them understand their impact, but also how to grow their impact over time. If the charities have better data, they’re going to make more impactful decisions with the funding they have, and the data can also provide accountability for philanthropic or government funders.
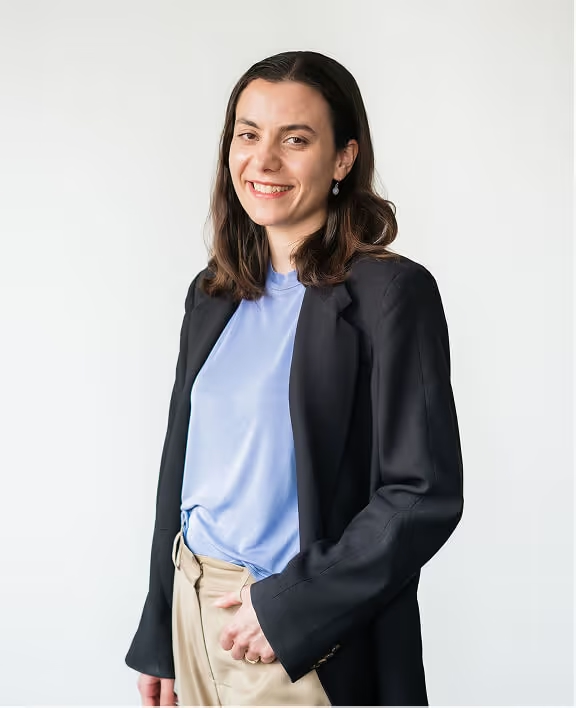
That’s right. There are a lot of insights sitting in the government data and academic evidence, but when we started six years ago, we saw that it was very difficult for charities to access those insights because you’re busy, you’re really resource-constrained, and often the impact of what you’re doing, you don’t see while you’re working with someone; it happens five or 10 years down the track. So, the government data and the academic evidence is really important for shedding light on that, but it’s very difficult to access. We try to bring it together in a way that’s practical, quite fast, and really oriented to the decisions that decision-makers can make, whether they’re funding charities or delivering services.
The key thing is to make the measurement useful and relevant to the people delivering the service, because then it shifts from being a compliance requirement, or ticking a box, to being about getting insight that can help grow the impact of the service.
I have a lot, but we worked with a youth mentoring charity a couple of weeks ago, and when we wrapped up their analysis, they realised that of the kids coming into their mentoring service, the ones who had three or more of a certain set of risk factors were far more likely to drop out early from the program. So now they’ve developed a different pathway of support for those kids to keep them in. That’s a win-win because the funder gets better visibility, but the ultimate win is more kids getting more support because of the insights.
We’ve found that people in frontline organisations are often really hungry for better information systems and to have better visibility to inform their work. There’s the appetite there, but they need the tools, you know?
One hundred per cent. When we first started, it took us six months to get quality modelling for a charity, and most of that time was trying to get the data out of the frontline crew, because people are so busy and they’re across so many things. So, we’ve had to focus on how do we make it easy and doable for frontline teams to make the most of their data. We’ve collapsed that process from six months to six weeks, just focusing on how we make that easier.
“The key thing is to make the measurement useful and relevant to the people delivering the service, because then it shifts from being a compliance requirement, or ticking a box, to being about getting insight that can help grow the impact of the service.”
The technology and the tools available to gather, manage and analyse data have really improved, and the cost of those has dropped a lot, so that’s been one really good thing. Also, at least in New Zealand, because we’ve worked with over 400 programs now and measured, like, a billion dollars of investment, along with others also helping bring measurement to the sector, we’ve seen a shift in expectations, so that what people think is possible has really shifted. I think once people see what’s possible, they lift their aspiration of what they can do.
I’m from a business analytics background, so my first job, prior to ImpactLab, was at the Boston Consulting Group in Sydney. I was doing a lot of analytics and strategy for using the analytics across the private and public sectors, but I did a Jawun secondment as part of that where I went over to Kununurra in WA for a couple of months. That experience blew my mind because I realised that the toilet companies I was working with had a much better understanding of the users of their service than the Australian government did of its most vulnerable kids.
I guess what got me into ImpactLab was seeing the opportunity to better connect the decision-making to a really good data-driven view of where is the money actually going, who’s it reaching and how does that make a difference, and then how can we use that information to make more of a difference with the next decision? A lot of decision-oriented analytics are really powerful; however, what the social sector tends to be using, which is also valuable, is academic analytics. What you need for decision-making is a bit different, and so that’s a gap, I think, that I really want to help solve.
Well, the process is challenging. When we start working with charities, we say if you’re doing this because you just want a good number, we’re probably not the right people to do it. We are going to have a really good look, we’re going to ask a lot of questions and put a third-party independent view to what you do. I think that is challenging for anyone, right? But it’s also what makes the process really powerful, especially from a fundraising perspective, because I think funders really value the objectivity of that and the independence of that. We work hard to keep the process super independent. Our methodology has been peer reviewed, I think three times, so it’s a very objective, independent process. Sometimes traders get numbers that aren’t what they expected or what they hoped for, but we’ve actually seen that’s often when the most impact in the process occurs. That drives learning and questioning.
We had one organisation with a health program where there were lots of people enrolled but they noticed that the older men didn’t actually access many or any health services and they hadn’t realised that. It was a surprise, but when they looked into it, they found it was because the older men didn’t know how to use the app that you had to use to make claims. They were able to go and address that.
It’s also sometimes a learning for us because charities sometimes will tell us our assumptions don’t make sense in their context, or we’ve missed something important. Having done this process 400 times, we learn something every time that improves the overall methodology.
The plan is always to listen to our customers, what it is that they want and what they need. From an Australian perspective, we’re just building out partnerships, finding charities and funders who really want to go on the journey with data and want to be able to explore the longer term impact of the services they’re supporting and lift their own data capability. We’re quite focused on building out our measurement toolkit for housing, because we’ve found that housing drives so many other outcomes for so many other services, but it works quite differently in terms of the profile of investment in the models of service delivery compared to other parts of the social sector. We’re building out a tailored methodology for that.
We continue to make the process more streamlined and use technology well so people who are very busy and have complex frontline work can engage with it seamlessly.
The third thing we’re focused on is more of the funder side. We have this rich data set of insights and research encompassing hundreds of interventions in the social sector. We’re working with funders on how we can analyse that aggregated data to come up with insights that can inform how they can better support their partners and how they invest for impact in what they do.
We used to hear from charities that they got an evaluation, and it was a 40-page report that they didn’t have time to read. It was a wall of text. So we have worked on how to simply and clearly communicate better, using a lot of data visualisations, simply presented metrics with key context around them. We try to make it as accessible as possible, and interestingly, because we’re presenting that data all the time to anyone from the lead person in a government agency right through to a frontline social worker, we've found that what’s relevant at the front line is also what’s relevant at the government decision-making table.
I love the WNBA, women’s basketball, and I love music – having a jam on the keyboard and the ukelele. My husband and I met at a circle dancing class, Balfolk – it’s a fusion of European folk dancing styles. Everybody else there is over 65.
Posted on 14 Oct 2026
Carers Victoria is holding an event this afternoon (October 14) during National Carers Week to…

Posted on 07 Oct 2026
Joseph Friedman is co-founder and publisher of About Time, Australia’s only newspaper for…
Posted on 30 Sep 2026
At 21 years old, Tate Donohoe is the founder of Ecodia, an AI-assisted software development company…
Posted on 02 Sep 2026
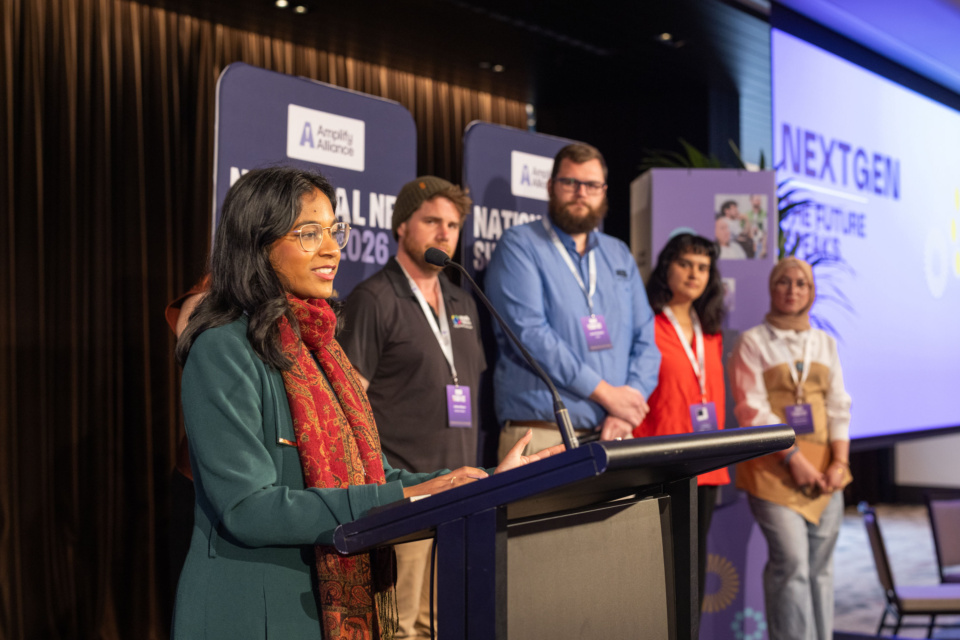
At last week’s Amplify Alliance National NFP Summit, Satara Uthayakumaran, 23, brought the voices…
Posted on 26 Aug 2026
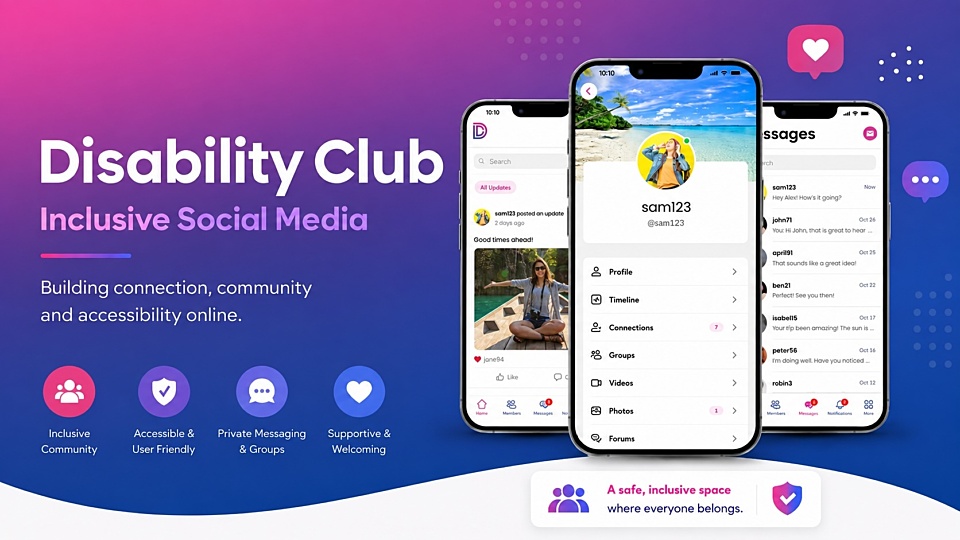
Nathan Johnston lives in Bega, NSW, and lives with cerebral palsy. He’s the creator of Disability…
Posted on 19 Aug 2026
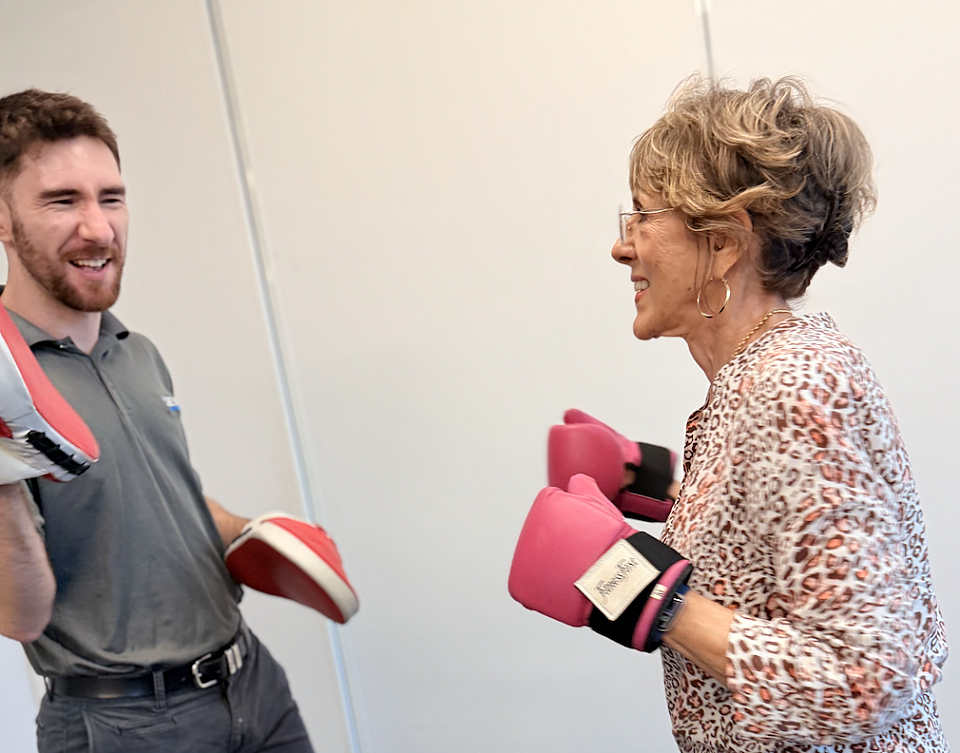
Coralie Wales is the founder of Strong Australia, an ACNC-registered health promotion charity that…
Posted on 08 Jul 2026
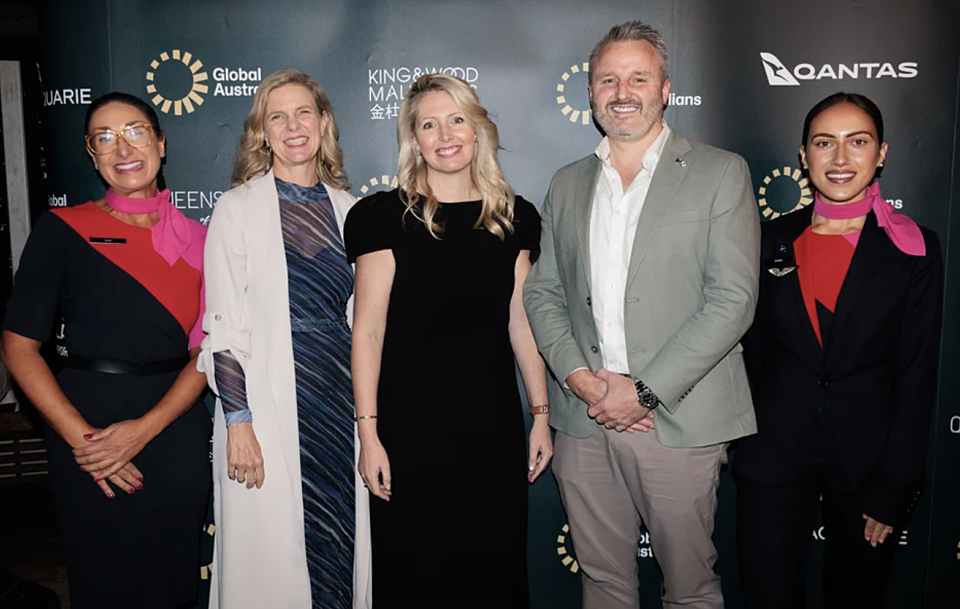
Kate McQuestin is CEO of Global Australians, a not-for-profit aimed at connecting Australians…
Posted on 30 Jun 2026
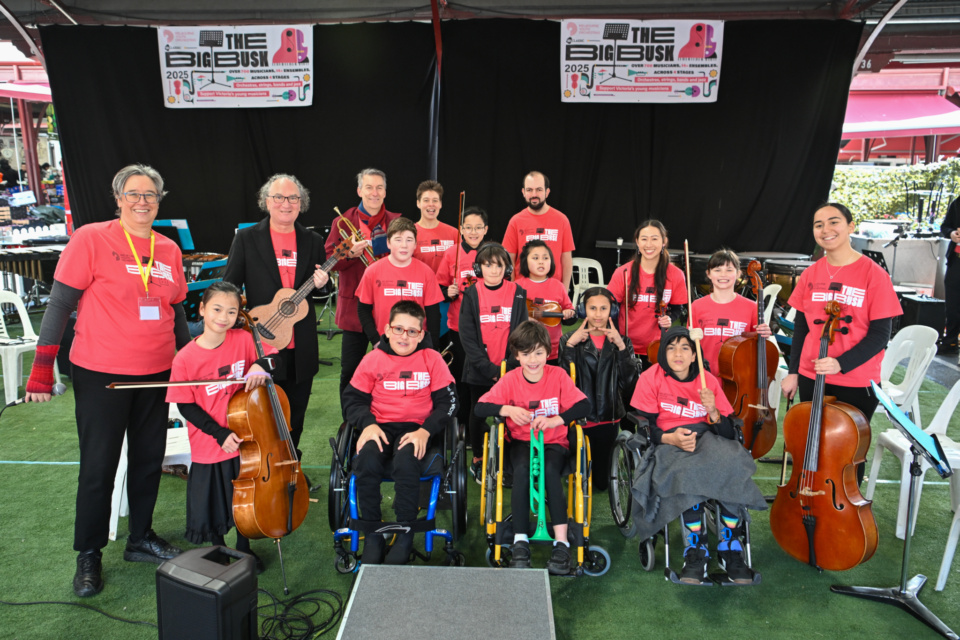
Anthea Skinner is a musicologist, a senior lecturer in disability creative performance at the…

Posted on 24 Jun 2026
Lizzie Mettam manages corporate partnerships for DV Safe Phone, an organisation that provides…
Posted on 17 Jun 2026
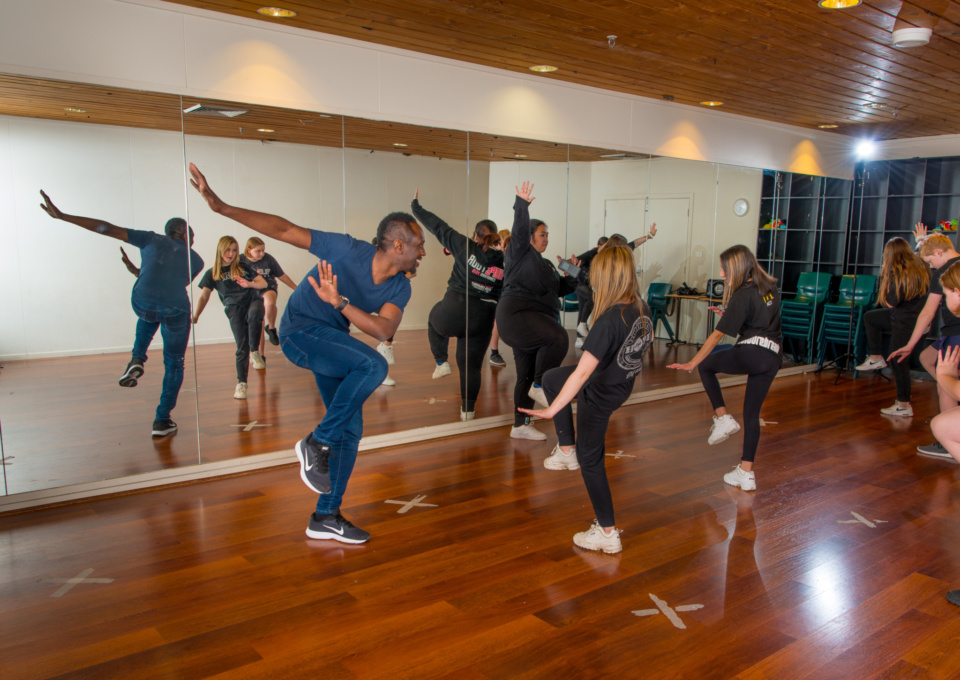
Francis Owusu is the founder of Kulture Break, a charity that helps young people build confidence,…
Posted on 10 Jun 2026
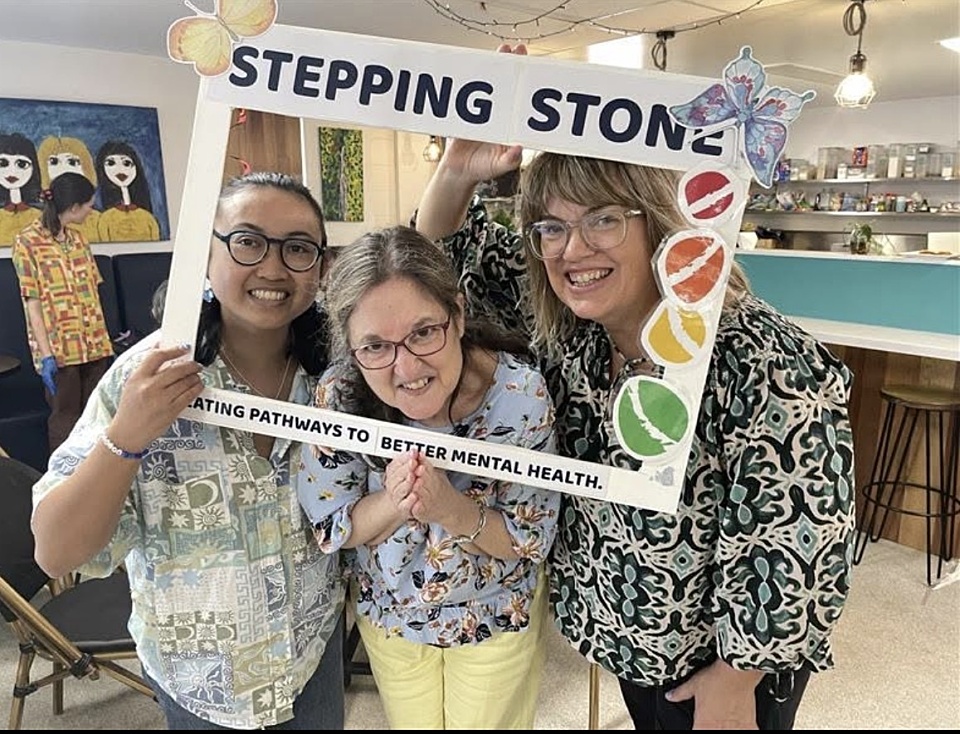
Melanie Sennett is the chief executive officer of Stepping Stone Clubhouse, a Brisbane charity that…
Posted on 03 Jun 2026
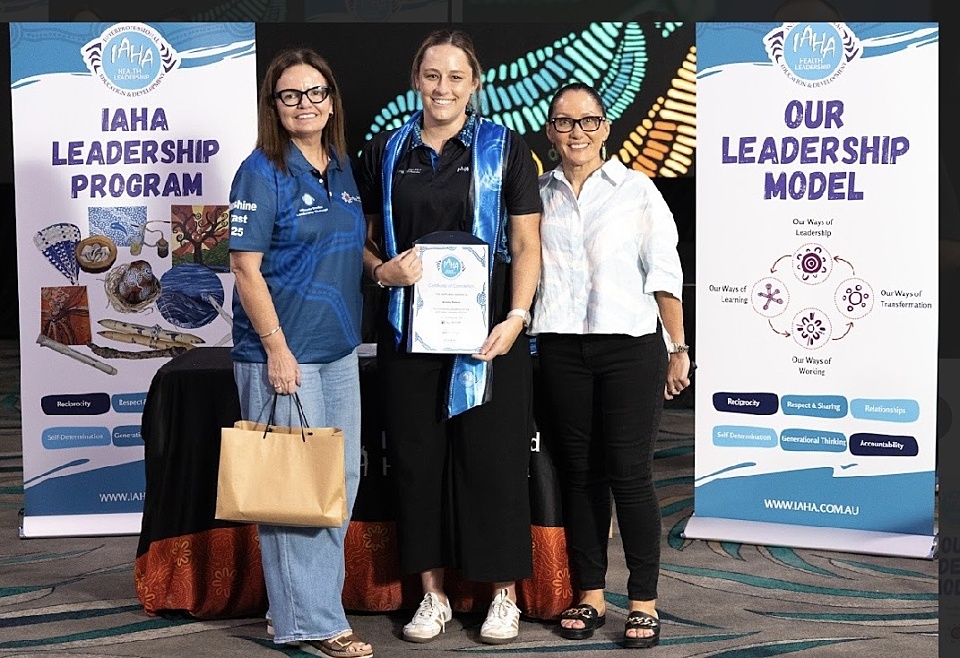
Kristy Petrie is a paediatric physiotherapist and proud Gooreng Gooreng woman who sits on the…